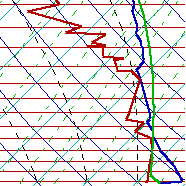
Sounding plot for Tallahassee on 15 Jul 1995 12Z. Blue line is temperature, red is the dew point, and green is the expected ascent path.

Sounding plot for Tallahassee on 15 Jul 1995 12Z. Blue line is
temperature, red is the dew point, and green is the expected ascent
path.
[Text Data]
[Severe Weather]
[Tropical Atlantic]
[Surface Data]
[Radar Data]
[Satellite Imagery]
[Model Output]
[ Server References]
[ Why this Page?]
| Constant Pressure Maps | ||||||
|---|---|---|---|---|---|---|
| Current | -12 hours | -24 hours | -36 hours | -48 hours | -60 hours | -72 hours |
| 925 mb | 925 mb | 925 mb | 925 mb | 925 mb | 925 mb | 925 mb |
| 850 mb | 850 mb | 850 mb | 850 mb | 850 mb | 850 mb | 850 mb |
| 700 mb | 700 mb | 700 mb | 700 mb | 700 mb | 700 mb | 700 mb |
| 500 mb | 500 mb | 500 mb | 500 mb | 500 mb | 500 mb | 500 mb |
| 400 mb | 400 mb | 400 mb | 400 mb | 400 mb | 400 mb | 400 mb |
| 300 mb | 300 mb | 300 mb | 300 mb | 300 mb | 300 mb | 300 mb |
| 250 mb | 250 mb | 250 mb | 250 mb | 250 mb | 250 mb | 250 mb |
| 200 mb | 200 mb | 200 mb | 200 mb | 200 mb | 200 mb | 200 mb |
| 150 mb | 150 mb | 150 mb | 150 mb | 150 mb | 150 mb | 150 mb |
| 100 mb | 100 mb | 100 mb | 100 mb | 100 mb | 100 mb | 100 mb |